Bu fayl "Vikimedia Commons"dadır və digər layihələrdə istifadə edilə bilər.
Faylın təsvir səhifəsinə get
Xülasə
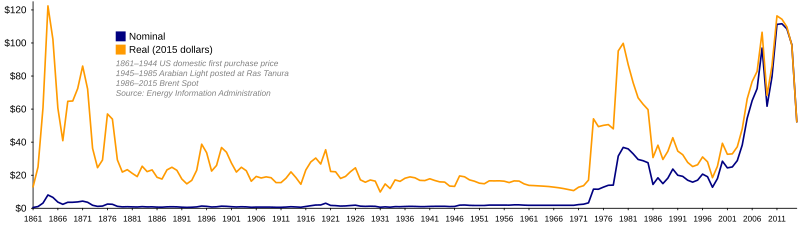
İzahOil Prices Since 1861.svg
I saw Image:Oil Prices 1861 2006.jpg recently and found it to be very useful. I noticed that it was in JPEG format, and saw that it was based on government sources which are available online, so I decided to recreate it in a lossless image format and update it to 2007. I've been experimenting with SVG lately, so I decided to try that instead of just saving a chart as a PNG. I found that I had to do a good bit of reverse engineering of data, and so I would like to document that here so that this graph can be more easily maintained in the future.
I found that the source quoted by the previous image, this spreadsheet from the Energy Information Administration (EIA), only provides data up to 1999 and uses 1999 dollars. It appears to provide conversions to real 1999 dollars using the United States Consumer Price Index (CPI), available from the Bureau of Labor Statistics here.
I studied the EIA web site further and noted that the author of the previous image brought the above spreadsheet up to date using the latest Brent Spot prices, available on this spreadsheet, also from the EIA. The update to 2006 dollars also appears to use the CPI.
I used the newest version of the above Brent Spot spreadsheet to get prices up to 2007, and converted to 2007 dollars using the latest CPI data.
I have thought about how to incorporate 2008 data, but haven't decided how to do it yet. The chart currently uses yearly averages; since 2008's not over yet, we don't have an average price for this year. I have to integrate it in a way that doesn't hurt the accuracy of the graph.
I have put further thought into how the EIA's 1861–1999 spreadsheet is constructed, with the intention of possibly improving it. I am not a commodities broker, nor am I an oil man, but I have a few thoughts:
Data from 1861–1944 is available on this page of annual average US domestic crude oil first purchase prices from 1859–2007. The chart leaves off 1859–1860 data. I am not sure why, but I imagine it's because it's disproportionately expensive: $16.00 in 1859 and $9.59 1860, both in the currency of the day, ridiculously expensive in today's money. 1859 was the year oil drilling began in the United States, in Titusville, Pennsylvania, and so I imagine it took a couple of years for prices to get down to realistic levels. Prices from the first couple of years of production are probably meaningless.
Data from 1945–1985 is said to be the price for "Arabian Light posted at Ras Tanura". I don't see anywhere else on the EIA web site where that data is found.
Data from 1986 and up is said to be the yearly average Brent Spot. Brent Spot prices are found elsewhere on the EIA web site, but the earliest price (from this spreadsheet) is from May 20, 1987. I am not sure why they don't have prices going back to 1986.
I think the spreadsheet converts to 1999 dollars using the United States Consumer Price Index for 1913 and up. When I convert to 1999 dollars using the CPI myself, I get numbers extremely close to the spreadsheet. It's close enough that I think either some decimal places got dropped somewhere or some earlier CPIs might have been reevaluated in the years since 1999. However, the CPI is not available from the BLS for years before 1912. I'm not sure where the spreadsheet got its 1861–1912 conversions. In 1975 the United States Census Bureau published Historical Statistics of the United States, Colonial Times to 1970, available here. It includes their best guesses at CPIs starting in 1800, but when I tried to use them my numbers were way off. Yes, I took into account that the book sets CPI=100 at 1967. They must have gotten their data from someplace else. Another possibility is the Historical Statistics of the United States Millenial Edition, here. Being a good 30 years newer, it may have drastically different data based on more accurate research. I would have to pay for access, though.
I am not a big fan of how the graph is a composite of three different sources. It sort of seems like an apples and oranges comparison to me. The 1861–1944 data is domestic crude oil first purchase price. The EIA defines "first purchase" this way:
An equity (not custody) transaction involving an arms-length transfer of ownership of crude oil associated with the physical removal of the crude oil from a property (lease) for the first time. A first purchase normally occurs at the time and place of ownership transfer where the crude oil volume sold is measured and recorded on a run ticket or other similar physical evidence of purchase. The reported cost is the actual amount paid by the purchaser, allowing for any adjustments (deductions or premiums) passed on to the producer or royalty owner.
The data from 1945–1985 is, as far as I understand, the price you would have paid for a barrel of light crude if you had dropped anchor at Ras Tanura and said "Load it up!". The price from 1986–present is the price you would have paid if you had gone into the International Petroleum Exchange in London flapping your arms around and shouting (or, starting in 2005, put a message to IntercontinentalExchange into a series of tubes).
These all seems subtly different to me. I think it would be better if the entire chart relied on the same source. Oil was not extracted in large quantities in the Middle East until the mid-20th century, and was first drilled in the North Sea in the 1970s, but the EIA has US domestic oil prices from 1859 all the way to today. It has month-by-month prices from 1974. Because the prices are for oil right at the field, they are lower than the market prices we're used to hearing, but they are still real prices and are from a consistent source. I am considering making a version of this graph that uses US domestic first purchase prices exclusively, and uses monthly data from 1974 onward so that we can go all the way to last month instead of waiting for the yearly average.
I made a graph that shows monthly Brent spot prices, which is available here. It provides a detailed, recent history. I plan to make some more graphs in the future.
Tarix
Mənbə
Öz işi
Müəllif
TomTheHand
Digər versiyalar
Arabic
Comment by Sammy Finkelman: Maybe for years before 1913 the Wholesale Price Index was used? That has been calculated back to 1749 and was published as far back as 1955 and maybe earlier.
If you do a Google Search for "Wholesale Price Index" 1749, you'll find an article from TIME Magazine from 1959 that discusses this a little bit. The Wholesale Price Index by now has been calculated back to 1720. They use different sources for different years.
Lisenziya
I, the copyright holder of this work, hereby publish it under the following licenses:
Bu fayl Creative Commons Attribution-Share Alike 3.0 Sinqapur lisenziyası altında yayımlanır.
Azadsınız:
paylaşmaq – əsəri köçürmək, paylamaq və ötürmək üçün
remiks etmək – əsəri adaptasiya etmək
Aşağıdakı şərtlərə riayət etməklə:
istinad – Müvafiq kredit verməlisiniz, lisenziyaya bir keçid verməlisiniz və dəyişikliklərin olub olmadığını bildirməlisiniz. Bunu hər hansı bir ağlabatan şəkildə edə bilərsiniz, ancaq lisenziyalaşdırıcının sizi və ya istifadənizi təsdiqləməsini təklif edən bir şəkildə deyil.
bənzər paylaşma – Əsəri remix edirsinizsə, dəyişdirirsinizsə və ya üzərində iş aparırsınızsa, öz töhfələrinizi orijinalda olduğu kimi eyni və ya uyğun lisenziya altında yayımlamalısınız.
Bu sənədi GNU Azad Sənədləşdirmə Lisenziyası, Versiya 1.2 və ya Azad Proqram Fondu tərəfindən nəşr olunan hər hansı sonrakı versiya şərtlərinə əsasən dəyişməz bölmələr, ön qapaq mətnləri və arxa qapaq mətnləri olmadan köçürmək, yayımlamaq və / və ya dəyişdirmək üçün icazə verilir; Lisenziyanın bir nüsxəsi GNU Azad Sənədləşdirmə Lisenziyası adlı hissəyə daxil edilmişdir.http://www.gnu.org/copyleft/fdl.htmlGFDLGNU Free Documentation Licensetruetrue
İstədiyiniz lisenziyanı seçə bilərsiniz.
Captions
Add a one-line explanation of what this file represents
== Summary == {{Information |Description=This image is an updated, vector graphics replacement for Image:Oil Prices 1861 2006.jpg. The graph is based primarily on [http://www.eia.doe.gov/pub/international/iealf/BPCrudeOilPrices.xls this spreadsheet]
{{Information |Description= |Source=self-made |Date=May 12, 2008 |Author= TomTheHand |Permission= |other_versions= }} This image is an updated, vector graphics replacement for Image:Oil Prices 1861 2006.jpg. The graph is
Bu faylda fotoaparat və ya skanerlə əlavə olunmuş məlumatlar var. Əgər fayl sonradan redaktə olunubsa, bəzi parametrlər bu şəkildə göstərilənlərdən fərqli ola bilər.
Genişlik
1450
Hündürlük
414
May 17, 2023
fayl, prices, since, 1861, fayl, faylın, tarixçəsi, fayl, keçidləri, faylın, qlobal, istifadəsi, metaməlumatlarbu, faylın, formatındakı, görünüşünün, ölçüsü, piksel, digər, ölçülər, piksel, piksel, piksel, piksel, piksel, piksel, faylın, orijinalı, 8206, faylı. Fayl Faylin tarixcesi Fayl kecidleri Faylin qlobal istifadesi MetamelumatlarBu SVG faylin PNG formatindaki bu gorunusunun olcusu 799 228 piksel Diger olculer 320 91 piksel 640 183 piksel 1 024 292 piksel 1 280 365 piksel 2 560 731 piksel 1 450 414 piksel Faylin orijinali 8206 SVG fayli nominal olaraq 1 450 414 piksel faylin olcusu 27 KB Bu fayl Vikimedia Commons dadirve diger layihelerde istifade edile biler Faylin tesvir sehifesine get Xulase IzahOil Prices Since 1861 svg I saw Image Oil Prices 1861 2006 jpg recently and found it to be very useful I noticed that it was in JPEG format and saw that it was based on government sources which are available online so I decided to recreate it in a lossless image format and update it to 2007 I ve been experimenting with SVG lately so I decided to try that instead of just saving a chart as a PNG I found that I had to do a good bit of reverse engineering of data and so I would like to document that here so that this graph can be more easily maintained in the future I found that the source quoted by the previous image this spreadsheet from the Energy Information Administration EIA only provides data up to 1999 and uses 1999 dollars It appears to provide conversions to real 1999 dollars using the United States Consumer Price Index CPI available from the Bureau of Labor Statistics here I studied the EIA web site further and noted that the author of the previous image brought the above spreadsheet up to date using the latest Brent Spot prices available on this spreadsheet also from the EIA The update to 2006 dollars also appears to use the CPI I used the newest version of the above Brent Spot spreadsheet to get prices up to 2007 and converted to 2007 dollars using the latest CPI data I have thought about how to incorporate 2008 data but haven t decided how to do it yet The chart currently uses yearly averages since 2008 s not over yet we don t have an average price for this year I have to integrate it in a way that doesn t hurt the accuracy of the graph I have put further thought into how the EIA s 1861 1999 spreadsheet is constructed with the intention of possibly improving it I am not a commodities broker nor am I an oil man but I have a few thoughts Data from 1861 1944 is available on this page of annual average US domestic crude oil first purchase prices from 1859 2007 The chart leaves off 1859 1860 data I am not sure why but I imagine it s because it s disproportionately expensive 16 00 in 1859 and 9 59 1860 both in the currency of the day ridiculously expensive in today s money 1859 was the year oil drilling began in the United States in Titusville Pennsylvania and so I imagine it took a couple of years for prices to get down to realistic levels Prices from the first couple of years of production are probably meaningless Data from 1945 1985 is said to be the price for Arabian Light posted at Ras Tanura I don t see anywhere else on the EIA web site where that data is found Data from 1986 and up is said to be the yearly average Brent Spot Brent Spot prices are found elsewhere on the EIA web site but the earliest price from this spreadsheet is from May 20 1987 I am not sure why they don t have prices going back to 1986 I think the spreadsheet converts to 1999 dollars using the United States Consumer Price Index for 1913 and up When I convert to 1999 dollars using the CPI myself I get numbers extremely close to the spreadsheet It s close enough that I think either some decimal places got dropped somewhere or some earlier CPIs might have been reevaluated in the years since 1999 However the CPI is not available from the BLS for years before 1912 I m not sure where the spreadsheet got its 1861 1912 conversions In 1975 the United States Census Bureau published Historical Statistics of the United States Colonial Times to 1970 available here It includes their best guesses at CPIs starting in 1800 but when I tried to use them my numbers were way off Yes I took into account that the book sets CPI 100 at 1967 They must have gotten their data from someplace else Another possibility is the Historical Statistics of the United States Millenial Edition here Being a good 30 years newer it may have drastically different data based on more accurate research I would have to pay for access though I am not a big fan of how the graph is a composite of three different sources It sort of seems like an apples and oranges comparison to me The 1861 1944 data is domestic crude oil first purchase price The EIA defines first purchase this way An equity not custody transaction involving an arms length transfer of ownership of crude oil associated with the physical removal of the crude oil from a property lease for the first time A first purchase normally occurs at the time and place of ownership transfer where the crude oil volume sold is measured and recorded on a run ticket or other similar physical evidence of purchase The reported cost is the actual amount paid by the purchaser allowing for any adjustments deductions or premiums passed on to the producer or royalty owner The data from 1945 1985 is as far as I understand the price you would have paid for a barrel of light crude if you had dropped anchor at Ras Tanura and said Load it up The price from 1986 present is the price you would have paid if you had gone into the International Petroleum Exchange in London flapping your arms around and shouting or starting in 2005 put a message to IntercontinentalExchange into a series of tubes These all seems subtly different to me I think it would be better if the entire chart relied on the same source Oil was not extracted in large quantities in the Middle East until the mid 20th century and was first drilled in the North Sea in the 1970s but the EIA has US domestic oil prices from 1859 all the way to today It has month by month prices from 1974 Because the prices are for oil right at the field they are lower than the market prices we re used to hearing but they are still real prices and are from a consistent source I am considering making a version of this graph that uses US domestic first purchase prices exclusively and uses monthly data from 1974 onward so that we can go all the way to last month instead of waiting for the yearly average I made a graph that shows monthly Brent spot prices which is available here It provides a detailed recent history I plan to make some more graphs in the future Tarix 12 may 2008 Menbe Oz isi Muellif TomTheHand Diger versiyalar Arabic Comment by Sammy Finkelman Maybe for years before 1913 the Wholesale Price Index was used That has been calculated back to 1749 and was published as far back as 1955 and maybe earlier If you do a Google Search for Wholesale Price Index 1749 you ll find an article from TIME Magazine from 1959 that discusses this a little bit The Wholesale Price Index by now has been calculated back to 1720 They use different sources for different years Lisenziya I the copyright holder of this work hereby publish it under the following licenses Bu fayl Creative Commons Attribution Share Alike 3 0 Sinqapur lisenziyasi altinda yayimlanir Azadsiniz paylasmaq eseri kocurmek paylamaq ve oturmek ucun remiks etmek eseri adaptasiya etmek Asagidaki sertlere riayet etmekle istinad Muvafiq kredit vermelisiniz lisenziyaya bir kecid vermelisiniz ve deyisikliklerin olub olmadigini bildirmelisiniz Bunu her hansi bir aglabatan sekilde ede bilersiniz ancaq lisenziyalasdiricinin sizi ve ya istifadenizi tesdiqlemesini teklif eden bir sekilde deyil benzer paylasma Eseri remix edirsinizse deyisdirirsinizse ve ya uzerinde is aparirsinizsa oz tohfelerinizi orijinalda oldugu kimi eyni ve ya uygun lisenziya altinda yayimlamalisiniz https creativecommons org licenses by sa 3 0 CC BY SA 3 0 Creative Commons Attribution Share Alike 3 0 true true Bu senedi GNU Azad Senedlesdirme Lisenziyasi Versiya 1 2 ve ya Azad Proqram Fondu terefinden nesr olunan her hansi sonraki versiya sertlerine esasen deyismez bolmeler on qapaq metnleri ve arxa qapaq metnleri olmadan kocurmek yayimlamaq ve ve ya deyisdirmek ucun icaze verilir Lisenziyanin bir nusxesi GNU Azad Senedlesdirme Lisenziyasi adli hisseye daxil edilmisdir http www gnu org copyleft fdl html GFDL GNU Free Documentation License true trueIstediyiniz lisenziyani sece bilersiniz CaptionsazerbaycancaAdd a one line explanation of what this file representsItems portrayed in this filetesvir ediryaradiciSome value without a Vikiverilenler itemmuellifin qisa adi TomTheHandWikimedia username nbsp ingilis TomTheHandURL nbsp ingilis https commons wikimedia org wiki user TomTheHandcopyright status nbsp ingiliscopyrighted nbsp ingilislisenziyaCreative Commons Attribution ShareAlike 3 0 Unported nbsp ingilisGNU Free Documentation License version 1 2 or later nbsp ingilisyaranma tarixi12 may 2008source of file nbsp ingilisoriginal creation by uploader nbsp ingilis Faylin tarixcesi Faylin evvelki versiyasini gormek ucun gun tarix bolmesindeki tarixlere klikleyin Tarix VaxtKicik sekilOlculerIstifadeciSerh indiki08 18 28 fevral 20161 450 414 27 KB Delphi2342015 19 13 1 iyun 20151 450 414 27 KB Delphi2342013 15 22 9 mart 20091 396 414 26 KB TomTheHandUgh didn 039 t use quite the right data set Sorry about all the re uploads I 039 m rusty with SVG 15 05 9 mart 20091 396 414 27 KB TomTheHandRemoving the circles at each data point Seems most common SVG renderers have trouble with them and don 039 t center them properly 15 02 9 mart 20091 398 414 27 KB TomTheHandWhoops updated a reference to 2007 in the graph 14 59 9 mart 20091 398 414 27 KB TomTheHandUpdating for 2008 I sort of regret putting the end year in the file name now 02 45 14 may 20081 386 414 29 KB TomTheHandFixed reversed legend colors 04 00 13 may 20081 386 414 28 KB TomTheHand Summary Information Description This image is an updated vector graphics replacement for Image Oil Prices 1861 2006 jpg The graph is based primarily on http www eia doe gov pub international iealf BPCrudeOilPrices xls this spreadsheet 03 00 13 may 20081 386 414 28 KB TomTheHand Information Description Source self made Date May 12 2008 Author TomTheHand Permission other versions This image is an updated vector graphics replacement for Image Oil Prices 1861 2006 jpg The graph is Fayl kecidleri Bu sekile olan kecidler Neft qiymetleri Faylin qlobal istifadesi Bu fayl asagidaki vikilerde istifade olunur ar wikipedia org layihesinde istifadesi ويكيبيديا ورشة الصور أرشيف 26 ast wikipedia org layihesinde istifadesi Crisis del petroleu de 1973 bar wikipedia org layihesinde istifadesi 1973 ba wikipedia org layihesinde istifadesi Neft eksportlausy ildәr ojoshmaһy ca wikipedia org layihesinde istifadesi Era del petroli cs wikipedia org layihesinde istifadesi Ropa Ropny zlom cv wikipedia org layihesinde istifadesi Nehtă cy wikipedia org layihesinde istifadesi Argyfwng olew 1973 da wikipedia org layihesinde istifadesi OPEC OAPEC de wikipedia org layihesinde istifadesi 1973 Stagflation Erdol Olpreiskrise Politische und soziale Geschichte des Islams Julian L Simon Diskussion Olfordermaximum Archiv 2 el wikipedia org layihesinde istifadesi Organismos E3agwgwn Petrelaioparagwgwn Xwrwn Petrelaikh krish toy 1973 Energeiakh krish ths dekaetias toy 1970 en wikipedia org layihesinde istifadesi Indira Gandhi 1973 oil crisis National Energy Program Peak oil 2000s energy crisis Talk 2000s energy crisis Alberta separatism Energy industry Albert Allen Bartlett Transportation demand management Age of Oil Talk 2000s energy crisis Archive 2 Talk Bjorn Lomborg Archive 3 Post World War II economic expansion 1970s energy crisis Economic policy of the Indira Gandhi government eo wikipedia org layihesinde istifadesi Naftoprezo es wikipedia org layihesinde istifadesi Crisis del petroleo de 1973 Tercer peronismo Era del petroleo eu wikipedia org layihesinde istifadesi Brent petrolioa 1973ko petrolioaren krisia fa wikipedia org layihesinde istifadesi بحران نفتی سال ۱۹۷۳ کاربر Aghajanpour جزوه درسی رفتارشناسی فرهنگ و معماری ایرانی بیماری هلندی اقتصاد ایران ۱۳۵۳ تا ۱۳۵۶ fiu vro wikipedia org layihesinde istifadesi 1973 a nahvtakriis fi wikipedia org layihesinde istifadesi Oljykriisi Julian Lincoln Simon Kayttaja Fiwiki tools bot kuvattomat 30 Bu faylin qlobal istifadesine baxin Metamelumatlar Bu faylda fotoaparat ve ya skanerle elave olunmus melumatlar var Eger fayl sonradan redakte olunubsa bezi parametrler bu sekilde gosterilenlerden ferqli ola biler Genislik1450Hundurluk414 Menbe https az wikipedia org wiki Fayl Oil Prices Since 1861 svg, wikipedia, oxu, kitab, kitabxana, axtar, tap, hersey,
ne axtarsan burda
, en yaxsi meqale sayti, meqaleler, kitablar, oyrenmek, wiki, bilgi, tarix, seks, porno, indir, yukle, sex, azeri sex, azeri, seks yukle, sex yukle, izle, seks izle, porno izle, mobil seks, telefon ucun, chat, azeri chat, tanisliq, tanishliq, azeri tanishliq, sayt, medeni, medeni saytlar, chatlar, mekan, tanisliq mekani, mekanlari, yüklə, pulsuz, pulsuz yüklə, mp3, video, mp4, 3gp, jpg, jpeg, gif, png, şəkil, muisiqi, mahnı, kino, film, kitab, oyun, oyunlar.